
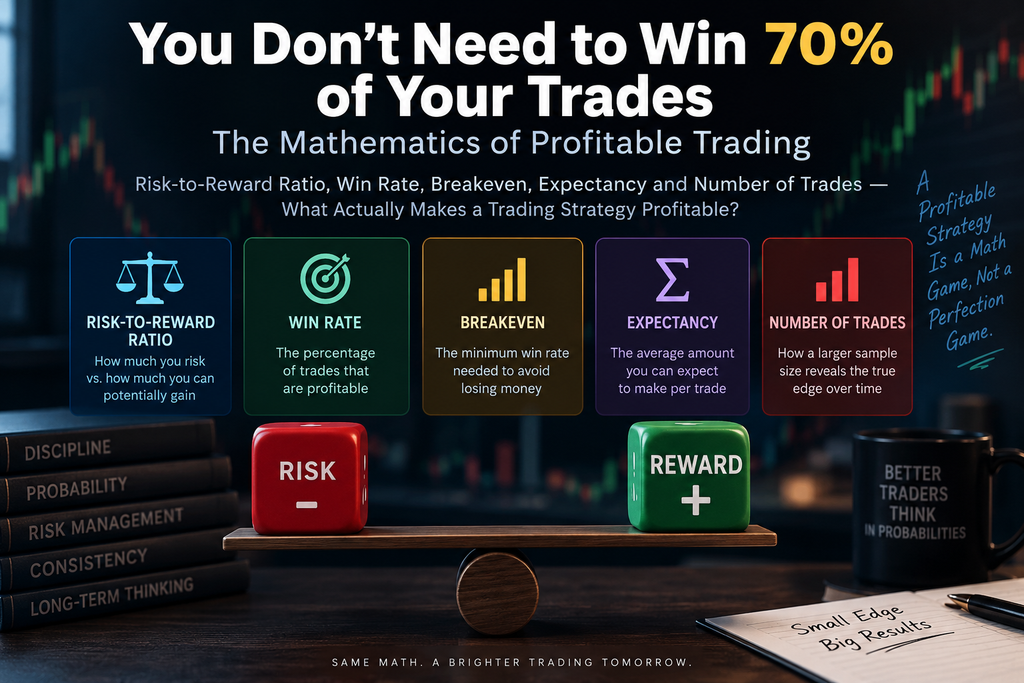
Profitable Trading and Risk Reward Ratio: You Don’t Need to Win 70% of Your Trades, What Actually Makes a Trading Strategy Profitable?
Imagine three traders.
Trader A wins 80% of his trades. Sounds impressive. But every time he loses, he loses four times what he normally makes.
Trader B wins only 40% of his trades. Yet when he wins, he makes twice what he loses when he is wrong.
Trader C wins just 30% of his trades. Most of his trades are losers. But his winners are three times the size of his losers.
Now answer one question:
Who is the better trader?
If your immediate answer is Trader A because “80% win rate” sounds superior, you have fallen into one of the oldest traps in trading.
The market does not pay you for being right frequently.
It pays you according to the economics of your decisions.
A trader can be wrong more often than right and still make money. Another can be right almost every time and still eventually blow up.
The difference is mathematics.
And the mathematics starts with five things:
Win rate + average win + average loss + number of trades + risk management.
1. The First Myth: “A High Win Rate Means a Good Strategy”
Win rate is simply:
Win Rate = Winning Trades ÷ Total Trades × 100
If you make 100 trades and 60 are profitable, your win rate is 60%.
Simple.
But win rate tells you only how frequently you are right. It does not tell you how much you make when right or how much you lose when wrong.
Consider these three hypothetical traders:
| Strategy | Win Rate | Average Win | Average Loss | Expectancy per Trade |
|---|---|---|---|---|
| A | 80% | ₹500 | ₹2,500 | -₹100 |
| B | 40% | ₹2,000 | ₹1,000 | +₹200 |
| C | 30% | ₹3,000 | ₹1,000 | +₹200 |
Trader A looks fantastic on social media.
Trader B looks mediocre.
Trader C might be mocked by someone who thinks “you need at least 60–70% accuracy.”
But mathematically, A is losing money while B and C have positive expectancy.
That is the first uncomfortable truth:
Accuracy and profitability are not the same thing.
2. Risk-to-Reward Ratio: The Basic Building Block
Suppose you enter a hypothetical NIFTY trade and decide that if you are wrong, you will lose ₹1,000.
If your planned profit is also ₹1,000:
Risk : Reward = 1 : 1
If your potential profit is ₹1,500:
Risk : Reward = 1 : 1.5
If potential profit is ₹2,000:
Risk : Reward = 1 : 2
And if potential profit is ₹3,000:
Risk : Reward = 1 : 3
For clarity, in this article:
1:2 means risking 1 unit to potentially make 2 units.
Example: NIFTY
Suppose a hypothetical NIFTY futures trade has:
- Entry: 25,000
- Stop-loss: 24,950
- Risk: 50 points
- Target: 25,100
- Reward: 100 points
The reward-to-risk relationship is:
100 ÷ 50 = 2
So the trade offers approximately 1:2 risk-to-reward.
But here is where many traders make another mistake.
They assume:
“1:3 is better than 1:1.”
Not necessarily.
A strategy that targets 3R may have a much lower probability of reaching the target.
A strategy targeting 1R might have a much higher probability of success.
The market does not give away large rewards for free.
3. Why 1:5 Is Not Automatically Better Than 1:1
Suppose two traders use the same NIFTY setup.
Trader A
Risk = ₹1,000
Target = ₹1,000
Potential reward = 1R.
Suppose the strategy wins 60% of the time.
Trader B
Risk = ₹1,000
Target = ₹5,000
Potential reward = 5R.
But suppose the strategy wins only 20% of the time.
Trader B’s trade looks much more attractive on paper.
But calculate the expectancy.
Trader A:
(0.60 × 1R) − (0.40 × 1R)
= +0.20R
Trader B:
(0.20 × 5R) − (0.80 × 1R)
= +0.20R
They are mathematically identical before costs.
This is the important lesson:
Reward-to-risk cannot be evaluated independently of probability.
A giant target is meaningless if your strategy rarely reaches it.
4. Breakeven Win Rate
Suppose your average loss is 1R and your average win is 2R.
What win rate do you need simply to break even?
At breakeven:
P × 2 − (1 − P) × 1 = 0
Therefore:
2P − 1 + P = 0
3P = 1
P = 33.33%
So a strategy that wins only one-third of its trades can theoretically break even with a 1:2 reward-to-risk structure.
The general formula is:
Breakeven Win Rate = Average Loss ÷ (Average Win + Average Loss)
Theoretical breakeven levels
| Reward : Risk | Theoretical Breakeven Win Rate |
|---|---|
| 1:1 | 50.00% |
| 1:1.5 | 40.00% |
| 1:2 | 33.33% |
| 1:3 | 25.00% |
| 1:4 | 20.00% |
| 1:5 | 16.67% |
These figures are before transaction costs.
And that qualification matters.
5. The Real Market Has Friction
A textbook calculation might say:
“My strategy has positive expectancy.”
But the real market has costs.
Indian traders can face:
- brokerage, depending on broker and product
- Securities Transaction Tax (STT)
- exchange transaction charges
- SEBI turnover fees
- GST on applicable services
- stamp duty
- slippage
- applicable taxes and other statutory charges
Therefore:
Gross expectancy ≠ Net expectancy
A strategy with a tiny theoretical edge can become a losing strategy after costs.
This is particularly important for high-frequency and very short-term strategies.
If your expected edge is ₹100 per trade and your total average friction is ₹80, your practical edge is only around ₹20 before considering other execution effects.
That is a very different business.
6. EXPECTANCY: The Number Traders Should Obsess Over
If there is one mathematical concept in this entire article that deserves your attention, it is expectancy.
Expectancy = (Probability of Win × Average Win) − (Probability of Loss × Average Loss)
Suppose:
- Win rate = 40%
- Average win = ₹2,000
- Average loss = ₹1,000
Then:
Expectancy = (0.40 × ₹2,000) − (0.60 × ₹1,000)
= ₹800 − ₹600
= ₹200 per trade
That does not mean the next trade will make ₹200.
It means that, assuming the underlying characteristics remain reasonably stable over a sufficiently large sample, the average expected result is ₹200 per trade before costs.
Expectancy is a statistical framework, not a profit guarantee.
7. Five Strategies That Destroy the “Win Rate = Success” Myth
| Strategy | Win Rate | Avg Win | Avg Loss | Expectancy |
|---|---|---|---|---|
| A | 80% | 0.25R | 2R | -0.20R |
| B | 65% | 0.60R | 1R | +0.04R |
| C | 55% | 1R | 1R | +0.10R |
| D | 40% | 2R | 1R | +0.20R |
| E | 30% | 3R | 1R | +0.20R |
Look at Strategy A.
80% win rate.
It still loses.
Now look at Strategy E.
30% win rate.
It has the same expectancy as Strategy D.
This is why asking:
“What is your win rate?”
without asking:
“What is your average win and average loss?”
is almost useless.
8. Number of Trades: More Is Not Automatically Better
Another dangerous misconception:
More trades = more money.
No.
More trades simply mean more opportunities to express your strategy.
Whether that produces more money depends on whether your strategy has positive expectancy after costs.
A trend-following strategy might legitimately generate only a handful of exceptional opportunities.
A short-term systematic strategy might generate hundreds.
The mistake is forcing a low-frequency strategy to generate more trades simply because the trader is bored.
That is not trading.
That is entertainment with brokerage charges.
9. The Sample-Size Problem
Suppose your strategy has produced:
10 trades
You have:
- 7 winners
- 3 losers
Your win rate is 70%.
Are you certain the strategy has a 70% win rate?
Absolutely not.
The sample is too small to confidently estimate the strategy’s true characteristics.
Now imagine:
1,000 trades
and the strategy produces:
- 420 winners
- 580 losers
The observed win rate is 42%.
That gives you considerably more information about the underlying distribution, although even 1,000 trades cannot guarantee that future performance will replicate historical performance.
Markets change.
Volatility changes.
Liquidity changes.
Participants change.
Regulations change.
Edges decay.
So sample size is necessary—but it is not sufficient.
There is another trap.
A strategy might genuinely produce only 10–20 high-quality opportunities a year.
Forcing it to generate 100 trades does not improve the sample.
It changes the strategy.
And often it changes it for the worse.
10. Monthly Performance Can Be Extremely Misleading
Suppose Trader A makes money almost every month but produces mediocre annual returns.
Trader B has several losing months but captures a few large trends and produces substantially better long-term results.
Which trader is better?
It depends.
Monthly consistency alone cannot answer the question.
The professional analysis should include:
- annual return
- maximum drawdown
- volatility
- Sharpe ratio
- Sortino ratio
- profit factor
- expectancy
- losing streaks
- risk per trade
- probability of ruin
Professionals think about the distribution of outcomes, not merely whether the current month is green.
11. Losing Streaks: The Part Traders Underestimate
Imagine a strategy with a 40% win rate.
That means the probability of losing a single trade is:
60%
The probability of three specific consecutive losses is:
0.60³ = 21.6%
Five consecutive losses:
0.60⁵ ≈ 7.78%
Seven consecutive losses:
0.60⁷ ≈ 2.80%
Ten consecutive losses:
0.60¹⁰ ≈ 0.61%
These are probabilities for a specific consecutive sequence, not the probability of experiencing at least one such streak over an entire trading career.
That distinction matters.
Over hundreds of trades, losing streaks become much less unusual than the trader’s emotions suggest.
And this is where traders destroy good systems.
After five losses they say:
“The strategy doesn’t work.”
After seven:
“The market has changed.”
After ten:
“I need a new strategy.”
Sometimes the strategy really has deteriorated.
But sometimes the trader is simply experiencing a normal part of the strategy’s return distribution.
You need data to tell the difference.
12. Position Sizing Determines Whether You Survive the Strategy
Consider the same strategy:
- 40% win rate
- 1:2 reward-to-risk
- positive expectancy
Now change only one thing:
risk per trade.
At 0.25% risk
Ten consecutive losses represent roughly 2.5% simple drawdown.
At 1% risk
Ten consecutive losses represent roughly 10%.
At 2% risk
Ten consecutive losses represent roughly 20%.
At 5% risk
Ten consecutive losses can cause devastating capital damage.
The trading signal has not changed.
The market has not changed.
Only the position size has changed.
Yet the financial and psychological outcome can become dramatically different.
This is why:
Strategy + position sizing + discipline = actual trading outcome.
13. Three Professional Traders Who Demonstrate Different Paths to Success
The most useful lesson from legendary market professionals is not to copy their trades.
It is to understand how differently successful market participants can operate.
Paul Tudor Jones: Risk Before Ego
Paul Tudor Jones built his reputation as a macro trader operating across markets including equity indexes, currencies and interest rates.
One of the most consistent themes in his public interviews is his focus on risk.
His career contains spectacular successes, but the more valuable lesson for a retail trader is the importance he places on protecting capital when the market moves against him.
His famous trading philosophy is not built around being right on every prediction.
It is built around managing what happens when the prediction is wrong.
That distinction matters.
A retail trader often spends hours trying to improve an entry by a few points while ignoring the position size that could determine whether the account survives the trade.
Jones’s approach suggests a different hierarchy:
Risk first. Opportunity second.
What retail traders can learn
- Protect capital before pursuing returns.
- Think about what can go wrong before thinking about how much you can make.
- Do not allow a single position to become existential.
- Be willing to change your view when the market invalidates it.
What retail traders should not copy
A professional macro fund operates with vastly different capital, liquidity, information, execution and risk-management infrastructure.
Copying a famous trader’s individual trade without understanding the surrounding portfolio is usually a foolish exercise.
George Soros: The Market Can Change the Reality
George Soros offers a completely different lesson.
His investment thinking is strongly associated with reflexivity—the idea that market participants’ perceptions can influence prices, while price movements can themselves influence the underlying reality.
This becomes particularly interesting during bubbles, crises and periods of extreme market expectations.
Instead of looking at a market purely as:
Price → fundamental value
Soros’s framework asks us to consider:
Beliefs → actions → prices → changing fundamentals → new beliefs
That feedback loop can produce powerful market trends.
His famous macro trades were not simply about finding an undervalued asset.
They involved understanding a broader system of expectations, policy, currencies, economic conditions and market psychology.
What retail traders can learn
- Markets are driven by expectations as well as fundamentals.
- Crowding matters.
- Narratives can become self-reinforcing.
- The market’s reaction to information can sometimes matter more than the information itself.
- A thesis can be intellectually correct but financially wrong if the market has already priced it in.
What retail traders should not copy
Do not try to reproduce a famous Soros trade simply because it appears obvious in hindsight.
The trade was embedded in a particular macroeconomic environment, portfolio and risk framework.
History is much cleaner after the event.
Ed Seykota: Let Trends Pay for the Losses
Ed Seykota became closely associated with systematic trend following.
His philosophy demonstrates one of the most important ideas in this article:
A strategy does not need to win most of the time if its winners can be substantially larger than its losers.
Trend following can involve numerous small losing trades.
Markets frequently fail to trend.
Breakouts fail.
Reversals occur.
Signals become false.
But when a genuine sustained trend appears, a disciplined trend follower attempts to remain exposed long enough for the larger move to compensate for many smaller losses.
That is the opposite psychological experience from a high-win-rate strategy.
The trader may experience:
Loss. Loss. Loss. Loss. Small win. Loss. Loss. Huge win.
To an inexperienced trader, that can look like terrible performance.
Mathematically, it can be excellent.
What retail traders can learn
- Cutting losses is not evidence that the strategy is failing.
- A losing trade can be a normal operating expense of the strategy.
- Do not interfere with the few trades that generate a disproportionate share of the profits.
- Rules can protect traders from their own emotions.
What retail traders should not copy
Do not assume every breakout strategy is trend following.
Do not blindly copy entry rules without understanding position sizing, volatility, portfolio correlation and the distribution of losing streaks.
14. Three Indian Market Professionals: Three Different Lessons
India’s market history provides another powerful demonstration that successful market participants do not all follow the same playbook.
Rakesh Jhunjhunwala: Trading and Investing Were Different Games
Rakesh Jhunjhunwala’s career is particularly useful because he operated across different time horizons.
He discussed futures positions held for shorter periods, delivery-based positions held for months and investments held over substantially longer periods.
That distinction is critical.
A futures position and a long-term equity investment may appear in the same person’s portfolio, but they should not be evaluated using the same framework.
His career also demonstrated the importance of conviction.
When he believed strongly in a business, his exposure could become significant.
But his public comments also repeatedly emphasised the importance of surviving losses.
That is a crucial combination:
Conviction without risk control = recklessness.
Risk control without conviction = indecision.
The skill lies in knowing when each is appropriate.
What retail traders can learn
- Separate trading from investing.
- Match position size to conviction and risk.
- Understand the time horizon of the thesis.
- Do not confuse temporary price volatility with permanent business deterioration.
- Most importantly, survive long enough to participate in future opportunities.
Vijay Kedia: Patience Is a Strategy
Vijay Kedia’s publicly discussed investment philosophy focuses on identifying businesses with capable management, products with potential and the ability to grow over time.
This is not a 5-minute NIFTY strategy.
And that is exactly why his example matters.
A long-term investor may make relatively few major investment decisions while spending enormous amounts of time researching businesses.
The absence of frequent transactions does not mean the absence of work.
Sometimes the highest-quality decision is not to trade.
Kedia’s approach highlights a lesson that short-term traders often forget:
Opportunity cost exists on both sides of a trade.
You can lose money by entering a bad position.
You can also lose money by unnecessarily selling a good position.
What retail traders can learn
- Patience is not inactivity; it can be a deliberate strategy.
- Business quality matters when the holding period is long.
- Price should be considered in relation to the underlying business.
- Do not create activity merely to feel productive.
Raamdeo Agrawal: Build a Framework, Not a Collection of Tips
Raamdeo Agrawal’s investment philosophy is associated with the QGLP framework:
Quality + Growth + Longevity + Price
The power of the framework is not the acronym itself.
It is the attempt to impose structure on decision-making.
A framework forces the investor to ask:
- Is this a quality business?
- Can it grow?
- Can that growth persist?
- Am I paying a sensible price?
This is fundamentally different from asking:
“Will the stock go up tomorrow?”
And that distinction matters.
A short-term trader may focus on price behaviour.
A long-term investor may focus on business economics.
Neither is automatically superior.
They are solving different problems.
What retail traders can learn
- Build a repeatable decision framework.
- Know what makes you enter a position.
- Know what would invalidate your thesis.
- Avoid collecting random tips from multiple sources.
- Concentration should follow genuine understanding, not excitement.
15. Six Professionals, Six Different Ways of Thinking
| Professional | Primary Style | Core Approach | Time Horizon | Major Lesson |
|---|---|---|---|---|
| Paul Tudor Jones | Macro trading | Respond to major market opportunities while aggressively controlling risk | Short to medium | Protect capital first |
| George Soros | Global macro | Exploit changing expectations, market psychology and reflexivity | Variable | Understand feedback loops |
| Ed Seykota | Systematic trend following | Cut losses and allow significant trends to produce larger gains | Medium to long | You can lose often and still win |
| Rakesh Jhunjhunwala | Trading + investing | Combine tactical trading with high-conviction long-term investments | Weeks to years | Match strategy to horizon |
| Vijay Kedia | Fundamental investing | Focus on business quality, management and long-term growth | Long term | Patience can be an edge |
| Raamdeo Agrawal | Fundamental investing | Structured evaluation through quality, growth, longevity and price | Long term | A framework beats random opinions |
Now look at the table carefully.
There is no single formula.
There is no universal holding period.
There is no universal trading style.
There is no universal definition of a “good trade.”
The common thread is much more important:
Each successful professional built a process around a particular edge and understood the risks associated with that process.
That is what retail traders should study.
Not their individual stock picks.
16. Ten Hypothetical Trading Strategies
Let’s make the mathematics even more uncomfortable.
Assume “R” means the amount risked on each trade.
| Strategy | Win Rate | Avg Win | Avg Loss | Trades/Year | Expectancy/Trade | Expected Annual R |
|---|---|---|---|---|---|---|
| High Accuracy Trap | 80% | 0.25R | 2R | 120 | -0.20R | -24R |
| Conservative | 65% | 0.60R | 1R | 100 | +0.04R | +4R |
| Balanced | 55% | 1R | 1R | 80 | +0.10R | +8R |
| Trend Trader | 40% | 2R | 1R | 60 | +0.20R | +12R |
| Asymmetric | 30% | 3R | 1R | 40 | +0.20R | +8R |
| Rare Big Winner | 25% | 4.5R | 1R | 20 | +0.375R | +7.5R |
| High Frequency | 70% | 0.5R | 1.2R | 250 | -0.01R | -2.5R |
| Short-Term Edge | 45% | 1.8R | 1R | 500 | +0.26R | +130R |
| Selective Swing | 52% | 1.4R | 1R | 50 | +0.248R | +12.4R |
| Breakout Asymmetry | 28% | 4R | 1R | 30 | +0.40R | +12R |
Notice Strategy 1.
80% win rate.
Negative expectancy.
Notice Strategy 10.
28% win rate.
Positive expectancy.
And notice Strategy 8.
A 45% win rate combined with a large number of trades can produce very different economics from a 45% win rate strategy taking only 20 trades.
That is why “What is your win rate?” is an incomplete question.
17. The ₹1,00,000 Example
Suppose you have:
Starting capital = ₹1,00,000
For simplicity, assume you risk 1% per trade, or:
₹1,000 = 1R
We’ll compare three strategies.
Strategy A
- Win rate = 60%
- Reward-to-risk = 1:1
- 100 trades
Expected wins:
60
Expected losses:
40
Gross profit:
60 × ₹1,000 = ₹60,000
Gross losses:
40 × ₹1,000 = ₹40,000
Expected gross result:
₹20,000
Expectancy:
+₹200 per trade
Strategy B
- Win rate = 40%
- Reward-to-risk = 1:2
- 100 trades
Expected wins:
40
Expected losses:
60
Gross profit:
40 × ₹2,000 = ₹80,000
Gross losses:
60 × ₹1,000 = ₹60,000
Expected gross result:
₹20,000
Expectancy:
+₹200 per trade
Strategy C
- Win rate = 30%
- Reward-to-risk = 1:3
- 100 trades
Expected wins:
30
Expected losses:
70
Gross profit:
30 × ₹3,000 = ₹90,000
Gross losses:
70 × ₹1,000 = ₹70,000
Expected gross result:
₹20,000
Expectancy:
+₹200 per trade
Three completely different strategies.
Three completely different win rates.
Three completely different psychological experiences.
Yet the same mathematical expectancy.
Now introduce transaction costs.
Suppose, purely for illustration, the average total round-trip cost and slippage works out to ₹100 per trade.
Across 100 trades:
100 × ₹100 = ₹10,000
The theoretical ₹20,000 gross expectancy becomes approximately:
₹10,000 net
Actual results can be substantially different because trade outcomes and costs vary.
This is why expectancy is a planning framework—not a promise.
18. Options Change the Game
Options deserve special treatment because they can create extremely attractive-looking statistics that hide ugly tail risks.
Consider an option-selling strategy.
It might produce:
- 8 profitable trades
- 2 losing trades
The win rate is:
80%
Fantastic?
Not necessarily.
Suppose:
- eight wins = ₹1,000 each
- two losses = ₹6,000 each
Gross:
₹8,000 − ₹12,000
= −₹4,000
The trader was right 80% of the time.
And still lost money.
Options introduce additional variables including:
- theta
- implied volatility
- volatility skew
- gap risk
- liquidity
- slippage
- nonlinear payoff
- tail risk
- changes in probability as the underlying moves
For option buyers, the problem can be reversed.
You may have several small losses followed by one very large winner.
For option sellers, frequent small gains can sometimes be accompanied by infrequent but severe losses.
Therefore:
Probability of profit is not the same as profitability.
And:
A high option win rate is not evidence that the strategy is low-risk.
Stop-losses also do not magically guarantee the exact loss you planned.
A gap, illiquidity or rapid price movement can produce execution materially different from the intended stop level.
Options are not inherently good or bad.
But they punish simplistic mathematics.
19. If Win Rate Is Not Enough, What Should You Measure?
Build a professional scorecard.
1. Win Rate
How frequently are you profitable?
2. Average Win
How much do winning trades make?
3. Average Loss
How much do losing trades cost?
4. Reward-to-Risk
What is the typical relationship between winning and losing trades?
5. Expectancy
What is the expected result per trade before and after costs?
6. Profit Factor
Gross Profit ÷ Gross Loss
A profit factor above 1 means gross profits exceed gross losses over the measured period.
7. Maximum Drawdown
What is the largest peak-to-trough decline?
8. Sharpe Ratio
Useful for comparing return relative to variability where the assumptions and return series make it appropriate.
9. Sortino Ratio
Similar to Sharpe, but focuses more specifically on downside variability.
10. Number of Trades
Is the sample large enough to tell you anything meaningful?
11. Longest Losing Streak
Can you psychologically survive it?
12. Average Holding Period
Does the strategy behave like a day-trading strategy, swing strategy or investment process?
13. Transaction Costs
How much of your gross edge disappears?
14. Slippage
Does your backtest assume prices that you cannot actually obtain?
15. Risk Per Trade
How much capital is genuinely exposed?
16. Position Size
Is your size appropriate for volatility and liquidity?
17. Annual Return
What did the strategy actually produce over a meaningful period?
18. Risk-Adjusted Return
What risk was taken to generate that return?
19. Probability of Ruin
Could a sequence of adverse outcomes mathematically destroy the strategy?
This is the difference between a trading diary and a trading business.
20. Your Trading Strategy Health Check
Copy this into your trading journal.
My Strategy
Win rate: ______ %
Average win: ₹ ______
Average loss: ₹ ______
Reward-to-risk: ______
Number of trades: ______
Expectancy: ______
Profit factor: ______
Maximum drawdown: ______ %
Longest losing streak: ______
Average holding period: ______
Transaction costs: ₹ ______
Slippage: ₹ ______
Risk per trade: ______ %
Position size: ₹ ______
Annual return: ______ %
Risk-adjusted return: ______
Estimated probability of ruin: ______
Now ask yourself:
Is the expectancy positive after realistic costs?
Is the sample size large enough?
Can I survive the worst historical losing streak?
Could I survive a losing streak worse than anything in my backtest?
Does the strategy still work if slippage is higher than expected?
Am I making money because of a genuine edge or because of a temporary market regime?
These questions are considerably more useful than:
“How accurate is my strategy?”
21. Ten Trading Beliefs That Sound Intelligent but Are Actually Dangerous
1. “I need a 70% win rate.”
Wrong.
You need positive expectancy.
2. “A 1:3 risk-reward ratio always works.”
Wrong.
A 1:3 target is useless if the strategy rarely reaches it.
3. “More trades mean more money.”
Wrong.
More trades can mean more costs and more exposure to negative expectancy.
4. “My strategy is broken after five losses.”
Not necessarily.
Five losses can be completely normal for a strategy.
5. “High win rate means low risk.”
Wrong.
A high win rate can coexist with catastrophic tail losses.
6. “Option sellers win most of the time, so selling options is safer.”
Dangerous nonsense.
Frequency of wins says nothing about the size of the losses.
7. “My stop-loss guarantees my risk.”
No.
A stop is an instruction, not a magical price guarantee.
8. “I made money for three consecutive months, so my strategy works.”
Three months can be meaningless.
You need enough data across relevant market regimes.
9. “Backtesting proves future profitability.”
No.
Backtesting provides evidence.
It does not provide certainty.
Overfitting can make a terrible strategy look brilliant in historical data.
10. “One great trade can make up for ten bad trades.”
Only if the size of that winner is actually large enough.
Mathematics decides.
Not motivational quotes.
22. The Real Relationship Between Win Rate and Risk-to-Reward
There is no magical “best” combination.
Consider:
Strategy 1
70% win rate + 0.5R average win + 1R average loss
Expectancy:
0.70 × 0.5 − 0.30 × 1
= +0.05R
Tiny edge.
Strategy 2
40% win rate + 2R average win + 1R average loss
Expectancy:
0.40 × 2 − 0.60 × 1
= +0.20R
Four times the expectancy.
The second trader is wrong more often.
Yet has a much stronger mathematical edge.
This is why professional thinking is fundamentally different from social-media trading culture.
Social media asks:
“How many trades did you win?”
Professional analysis asks:
“What was the distribution of returns generated by the strategy, relative to the risk taken?”
Huge difference.
23. The Hidden Variable: Survival
There is one variable that does not get enough attention:
Survival.
Suppose Strategy X has excellent long-term expectancy.
But it occasionally suffers a 40% drawdown.
If you use excessive leverage, you may be wiped out before the strategy has enough time to realise its statistical edge.
That is the paradox.
A strategy can be mathematically profitable and practically untradeable.
This is why probability of ruin matters.
If you risk too much per trade, the path to your long-term expected return may become impossible.
You cannot compound capital you no longer have.
24. The Difference Between a Good Strategy and a Good Trader
A good strategy can lose money.
A good trader can lose money.
A losing trade does not automatically mean a bad decision.
Likewise, a profitable trade does not automatically mean a good decision.
Suppose you ignore your stop, hold a losing NIFTY position and eventually it comes back.
You make ₹20,000.
Was it a good trade?
No.
You were lucky.
Now suppose you follow your rules perfectly and lose ₹5,000.
Was it a bad trade?
Not necessarily.
If the decision was consistent with your tested strategy, it may have been an excellent trade with an unfavourable outcome.
This distinction is fundamental:
Judge the process separately from the outcome.
25. The Professional Mindset
A professional trader understands that every trade is only one observation from a distribution.
Trade #1 means little.
Trade #2 means little.
Even trade #10 may mean very little.
The objective is not to predict every outcome.
The objective is to execute a positive-expectancy process over enough opportunities while controlling risk.
Think about a casino.
A casino does not need to win every hand.
It needs:
An edge × sufficient volume × controlled risk × survival.
A trader with a genuine edge operates on a similar principle.
But there is one crucial difference.
A casino can often control the rules of the game.
A trader cannot.
The market can change the game.
That is why adaptability matters.
26. So, How Many Trades Should You Take?
There is no universal answer.
A better question is:
How many valid opportunities does my edge actually produce?
If your tested strategy produces:
20 high-quality trades a year
then 20 may be correct.
If it produces:
500 statistically meaningful opportunities
then 500 may be correct.
But if you manufacture additional trades simply because you want to “increase your sample size,” you are contaminating your experiment.
Do not confuse:
more observations
with
more valid observations.
27. The Formula That Actually Matters
If you remember only one formula from this article, remember this:
Expectancy = (Win Probability × Average Win) − (Loss Probability × Average Loss)
Then remember:
Net Expectancy = Gross Expectancy − Transaction Costs − Slippage − Other Trading Frictions
And finally:
Actual Outcome = Edge × Execution × Position Sizing × Discipline × Survival
The last equation is a practical framework rather than a mathematical identity.
Because having an edge on paper is worthless if you cannot execute it.
28. The Final Framework
A genuinely robust trading strategy requires:
Edge
There must be some reason why the expected distribution of outcomes is favourable.
Without an edge, risk management only slows down the losses.
Positive Expectancy
Your average outcome must be positive after realistic costs.
Adequate Sample Size
You need enough observations to distinguish signal from noise.
Risk Management
You must control the size of losses.
Position Sizing
The same strategy can produce radically different outcomes depending on how much capital you put behind each trade.
Discipline
A strategy you cannot follow is not your strategy.
It is merely a document on your laptop.
Survival
You must remain in the game long enough for your statistical edge to have a chance to work.
Conclusion: Stop Trying to Be Right All the Time
The trading industry has created an obsession with being right.
Screenshots celebrate winning trades.
Social media celebrates accuracy.
Marketing campaigns advertise strategies with extraordinary win rates.
But markets do not reward your ego.
They reward favourable economics.
A trader who wins 80% of the time can lose money.
A trader who wins 30% of the time can make money.
A trader who takes 500 trades can underperform someone taking 20.
A trader with a brilliant backtest can lose money in live markets.
And a trader with a mediocre-looking win rate can build a robust process around positive expectancy, sensible position sizing and disciplined risk control.
The six professionals discussed in this article demonstrate the same principle through radically different approaches.
Paul Tudor Jones built his approach around macro opportunities and aggressive risk control.
George Soros focused heavily on expectations, market psychology and reflexivity.
Ed Seykota demonstrated the power of systematic trend following and letting large trends compensate for numerous smaller losses.
Rakesh Jhunjhunwala demonstrated that trading and investing can coexist across radically different time horizons.
Vijay Kedia’s philosophy highlights patience and business quality.
Raamdeo Agrawal demonstrates the value of a structured investment framework rather than random stock selection.
Their methods were different.
Their markets were different.
Their time horizons were different.
Yet the lesson is remarkably similar:
There is no single combination of win rate, risk-reward and trading frequency that creates a great trader.
The real question is whether the process has an edge, whether the mathematics are favourable, whether the costs are controlled, and whether the trader can survive the inevitable periods when the strategy stops working temporarily.
So don’t ask:
“How often will I win?”
Ask:
“How much do I expect to make or lose each time I deploy capital, how often does my edge occur, and can I survive the losing streaks?”
That is a much more intelligent question.
Because ultimately:
Edge + Positive Expectancy + Adequate Sample Size + Risk Management + Position Sizing + Discipline + Survival
That is the foundation.
Not a 70% win rate.
Not a flashy screenshot.
Not a guaranteed setup.
And certainly not one lucky trade.
A trader does not get paid for being right frequently. A trader gets paid for having an edge, controlling losses, sizing positions intelligently, and surviving long enough for that edge to play out.
For more practical, evidence-based financial-market education covering equities, derivatives, commodities, banking and market behaviour, explore the educational resources at DiscussMarkets.com — Institute of Financial Markets.